My first project
The aim of this tutorial is to easily display data and to provide results with a simple linear regression.
We will use the preloaded cars dataset.
Creating a New Project
Begin a new project with the File menu, then NewProject..., select RPGM project, and name it "LinearRegression".
The project is created with two files: LinearRegression.ppro, which contains the general properties of the program, and main.pseq.

The file main.pseq will contain a sequence of tasks in the form of a flowchart, and RPGM will execute each step by following the order of the flowchart. It has a Start step and we will connect a new step to this one.

At any time, the program can be tested and executed by pressing F5.
Creating the first interface
Our first goal is to show the data of the cars variable which already exists in R. To do so, a graphical interface must be created and added to main.pseq.
Do a right click on the File explorer, choose New File and select PGM interface (.pgui) on the right and name the file ShowInputs.pgui. Before adding elements to the interface, it must be added in the sequence. Go back to main.pseq and with a right click choose Add a GUI. Click on the created step and in the property window, add ShowInputs.pgui in File. An easier way to add a step in the sequence is to drag and drop ShowInputs.pgui from the File explorer onto the sequence editor. Now, add an arrow from the Start step to our new GUI step by drag and dropping with the mouse. To remove the last error, with a right click, choose Add an end and connect ShowInputs.pgui with it.

Save the sequence with CTRL+S and press F5; you can see that the application now enters the GUI step, but it is currently empty. Go back in the ShowInputs.pgui file with a double click on its step in main.pseq. In the GUI Editor, click on + Add a widget, click on Label to add a Label, and then close the panel. You can now access to the properties of your widget by clicking on it in the preview interface.
- Leave the ID field empty. The ID field is used for getting and manipulating the value of the widget in R.
- In Value, write Linear Regression Cars as the text of the label.
- In Font size choose 32.

We will now add a Grid widget for displaying the data cars.
- Add a new Grid with + Add a widget and clicking on Grid.
- Set the ID field to ShowData, this will create a variable named
ShowDataif you want to access it in R after this step. - Set the Label field to Data:.
- Set the Value field to cars. Make sure the R expr. checkbox is checked, as
carsis an R expression that must be evaluated with R. Otherwise RPGM will try to set the value to "cars" as a string of 4 characters. - Set the Data type to Floats.

By pressing F5, the current result is:

Executing R code
We will now write an R code for computing the linear regression. Use a right click on the File explorer and choose New file, and name the new file Regression.R. Don't forget that the script must be added in the Sequencer to be executed. Go back on main.pseq and add an R Script step linked to the Regression.R file and connect it to ShowInputs.pgui so that the R file will be executed after our graphical interface. Don't forget that you can directly drag and drop the file from the File explorer in order to add it in the sequencer.

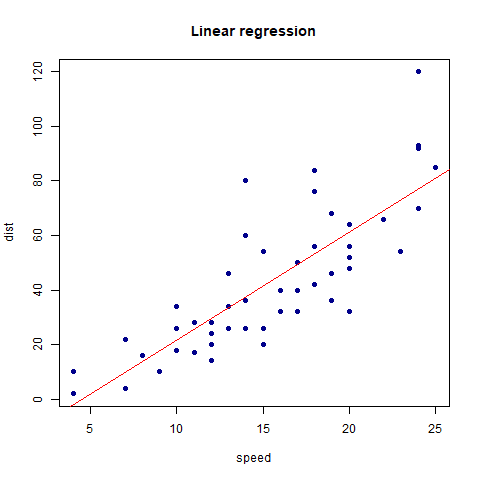
We write the following code, which computes the linear regression of dist against speed for the cars data. It also provides a graphic that we will display in another step.
png(rpgm.outputFile("regression.png"))
    plot(cars, pch=16, col="darkblue", main="Linear regression")
    reg <- lm(dist ~ speed, data=cars)
    abline(reg$coefficients, col="red")
dev.off()

The function rpgm.outputFile generates a path within the output folder. Press F5 to execute the application. The output folder can be opened at the end where we have our graphic:

You get this graphic in the output folder.
Showing result
Now it's time to show the graphic to the user in a new GUI. Create a new PGM interface (.pgui) file, name it Results.pgui, and add it to main.pseq after the R script. The graphic will be displayed with an Image widget, since our graphic is an image. There is also a Graph widget for displaying interactive graphics, but we will use an image for now.
In Results.pgui, create a Label field with Results as value and 32 for the font size. Then add a second widget of type Image and set the value field to rpgm.outputFile("regression.png") with the box Is an R expression checked.

We get the following result by executing the program:

Changing project settings
We finish by changing the project file:
- Open LinearRegression.ppro;
- Fill the Program Name field with Linear Regression Cars;
- Download this image and place it in the project folder;
- Fill the Top logo field with logo.png ;
- In the ChangeLog tab at the top, click the Add line button and fill the line. Your file should look like this:

Press F5, you can see the title on the left and the image.

This ends our first very simple program! You can download the program as a pgm file for RPGM here (that you can create with the top menu PGM -> Export as PGM) and as a zip file containing all the project for RCode here.