Dynamism & Layout
The aim of this tutorial is to begin managing the layout of your application and to have interactions between widgets. We will create a small dashboard in which we can perform simulations.
Create a new project with the File menu, then New project..., select RPGM project and name our new project "FrequencySimulation".
Creating the GUI
Our first goal is to ask the user for a distribution. Add a new file PGM interface (.pgui) and name it inputs.pgui. Add it to the sequencer.
In inputs.pgui, add a new Label widget. Fill it with <strong>Frequency Simulation</strong>. Note that RPGM supports HTML. Here, all the text between <strong>and </strong> is in bold style. This trick works everywhere for any text displayed in RPGM. Give it a Font size of 32.

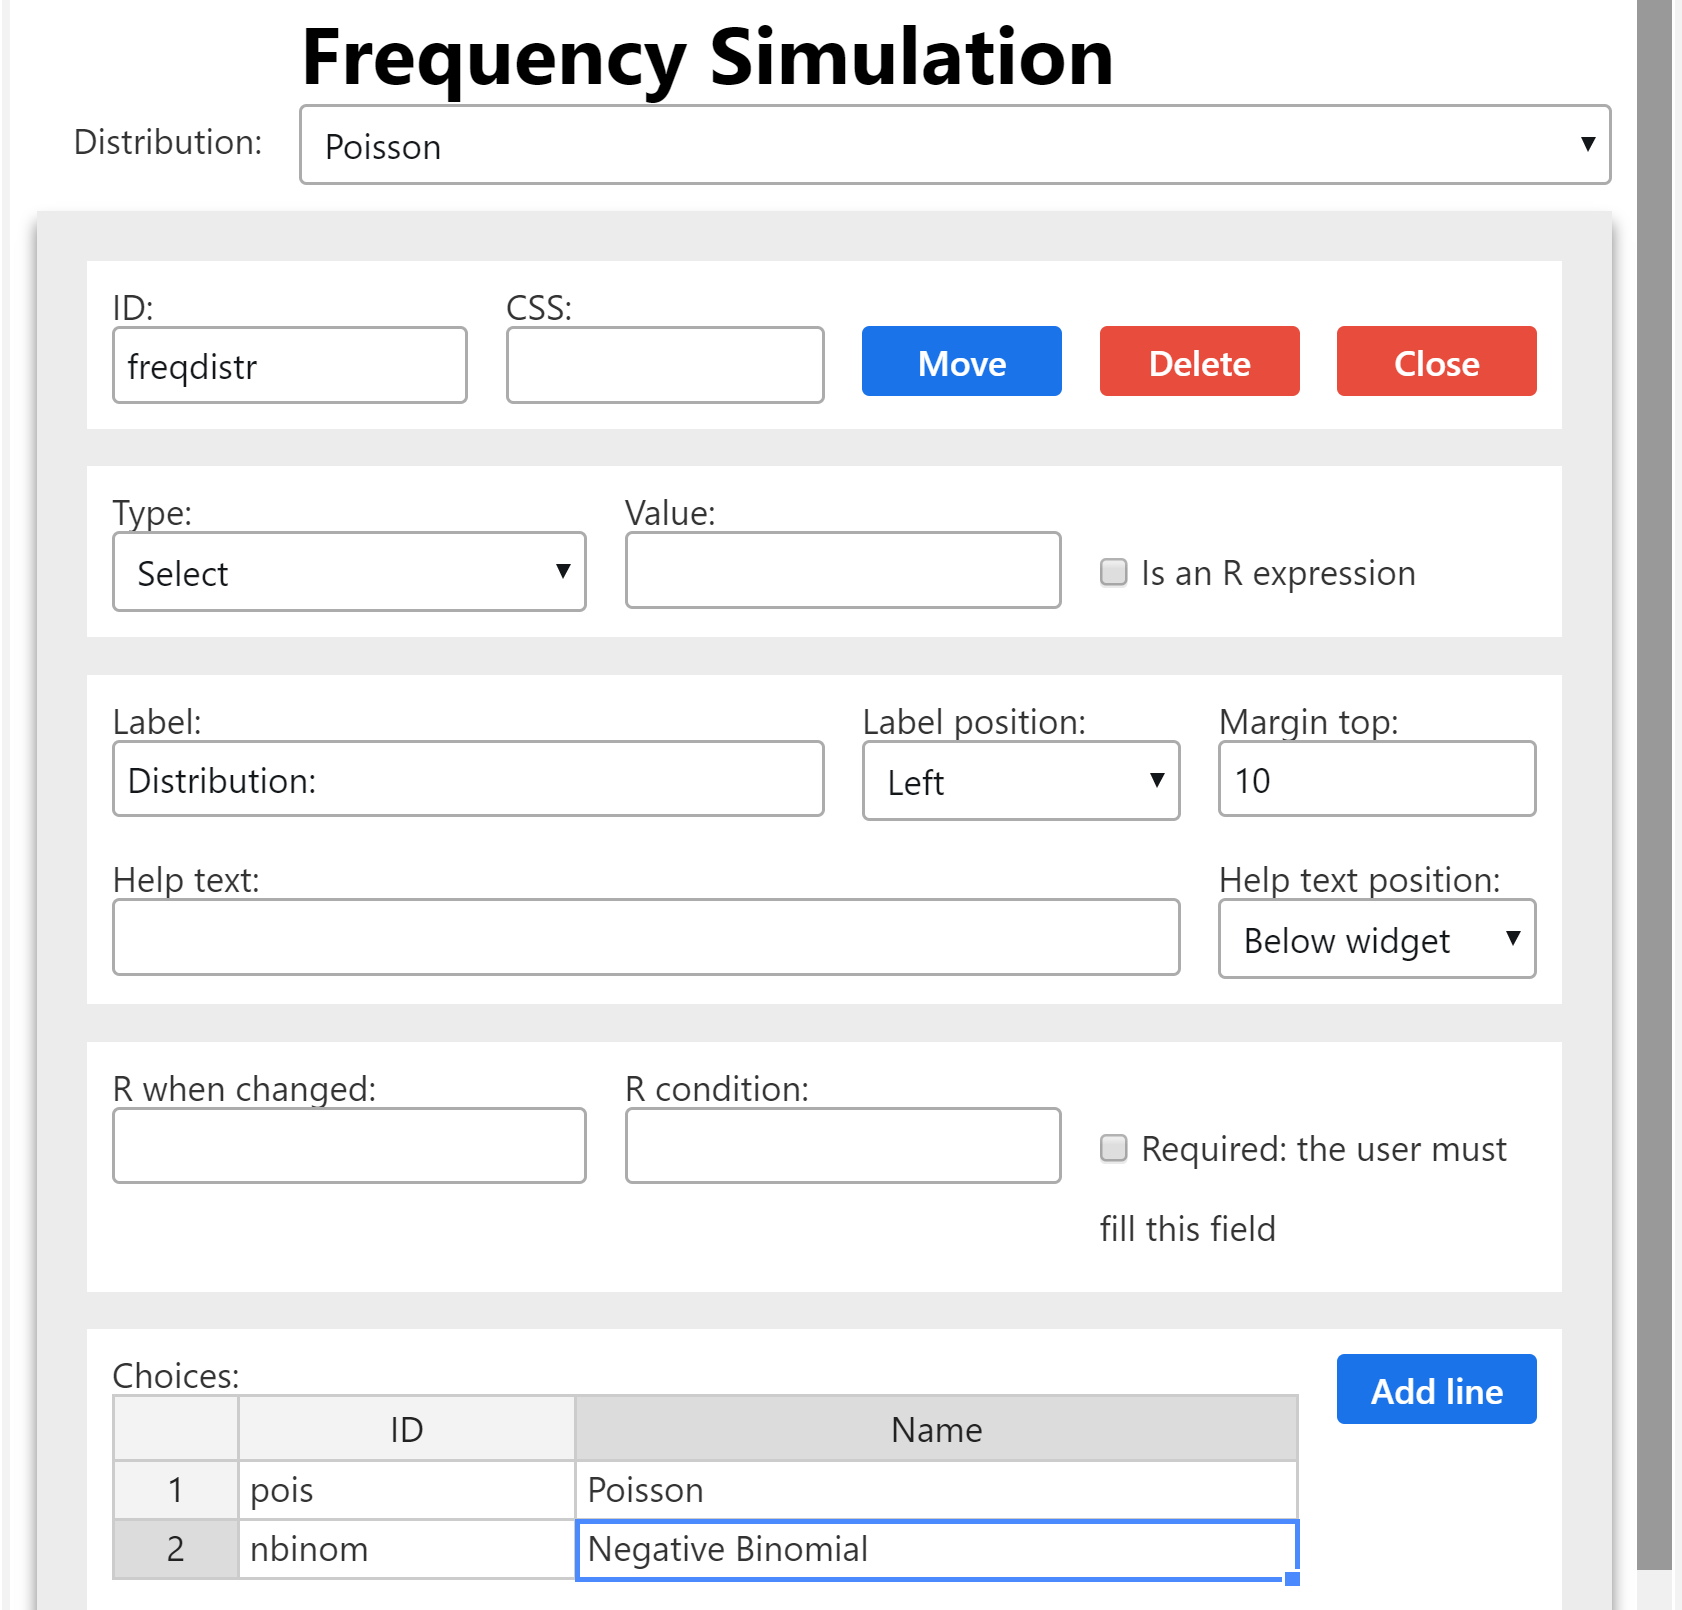
Save and test the program with F5. Now we will add the choice of the distribution. Add a new widget of type Select. Give it the ID: freqdistr and the Label: Distribution:. For the Choices, add two lines. The column ID refers to the returned value in R (in the ID variable, here freqdistr). The column Name refers to the text displayed in RPGM for the corresponding choice.
For the first line, fill it with:
- ID: pois
- Name: Poisson
And the second line, fill it with:
- ID: nbinom
- Name: Negative Binomial
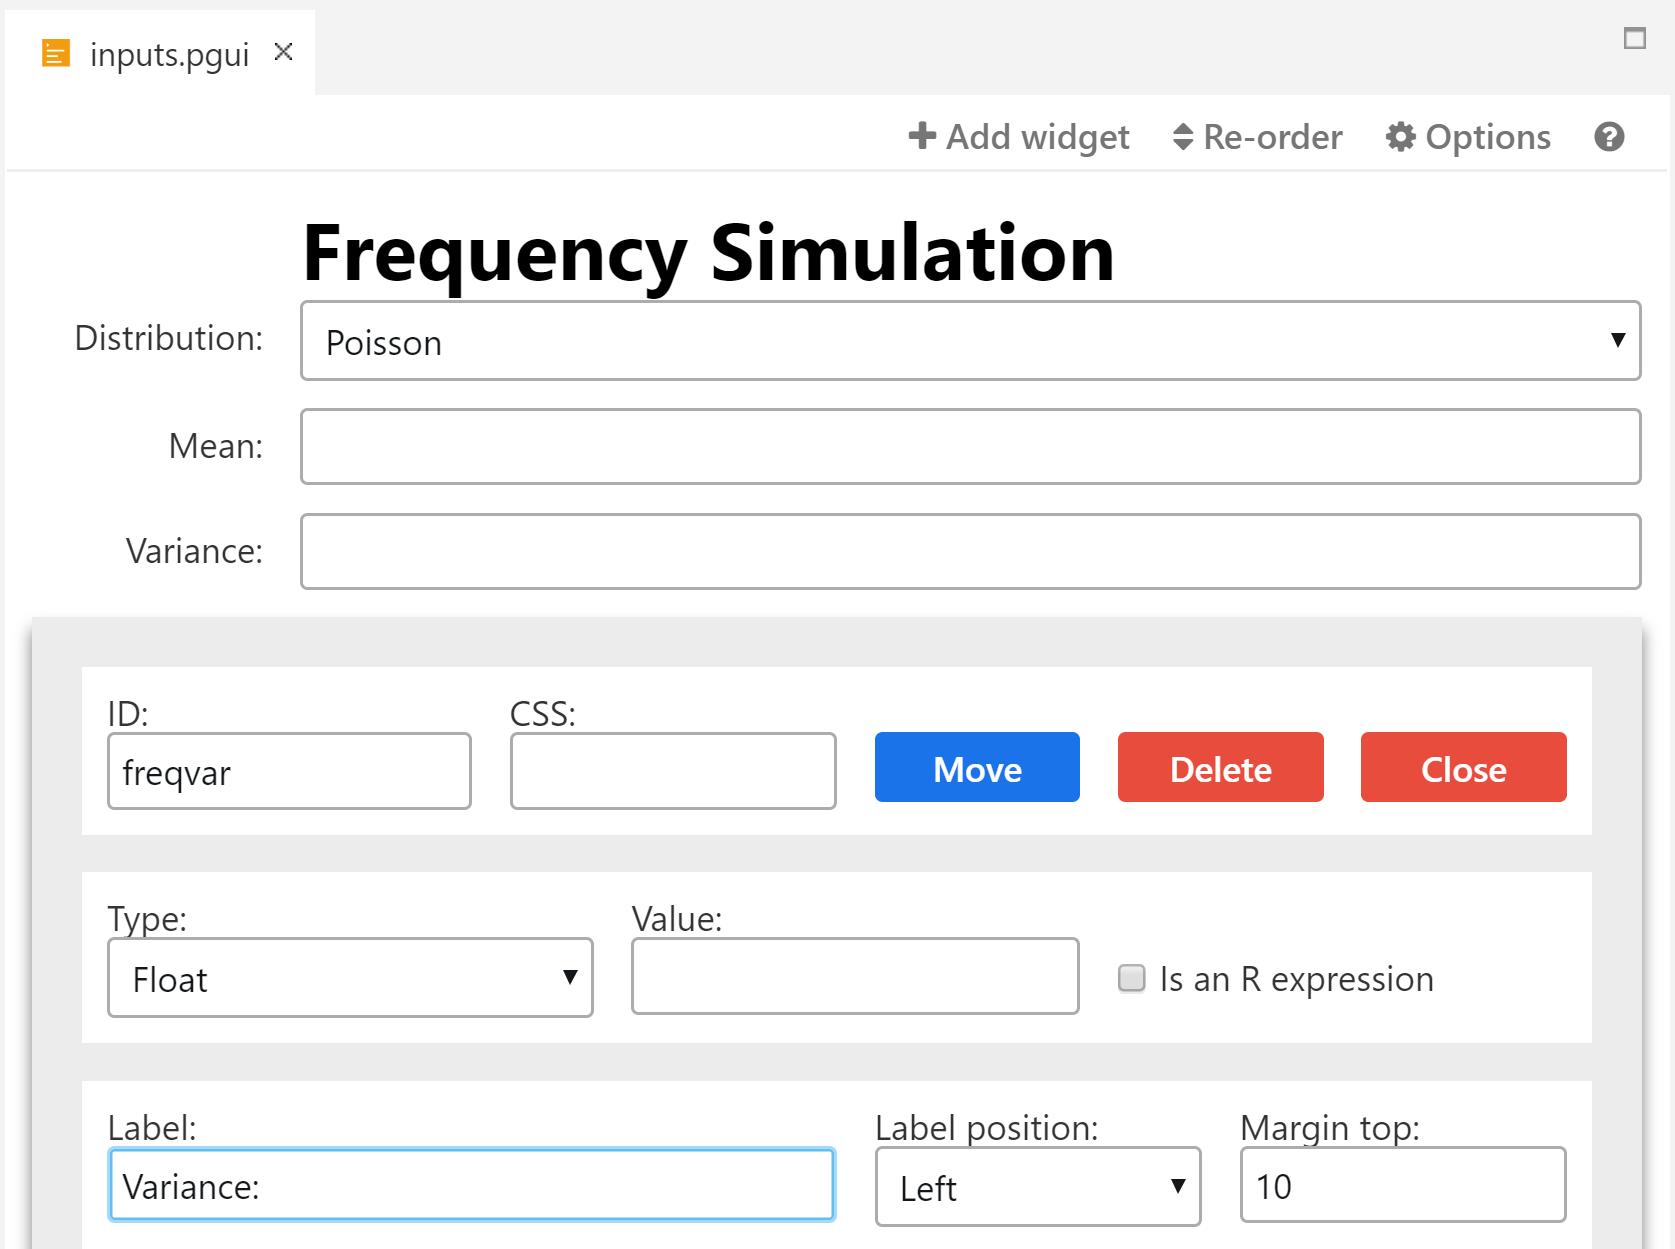
Add two widgets of type Number. The first one, with ID freqmean and Label Mean:, the second one with ID freqvar and Label Variance:. However, we do not need the variance in the case of the Poisson distribution, we will manage it later.
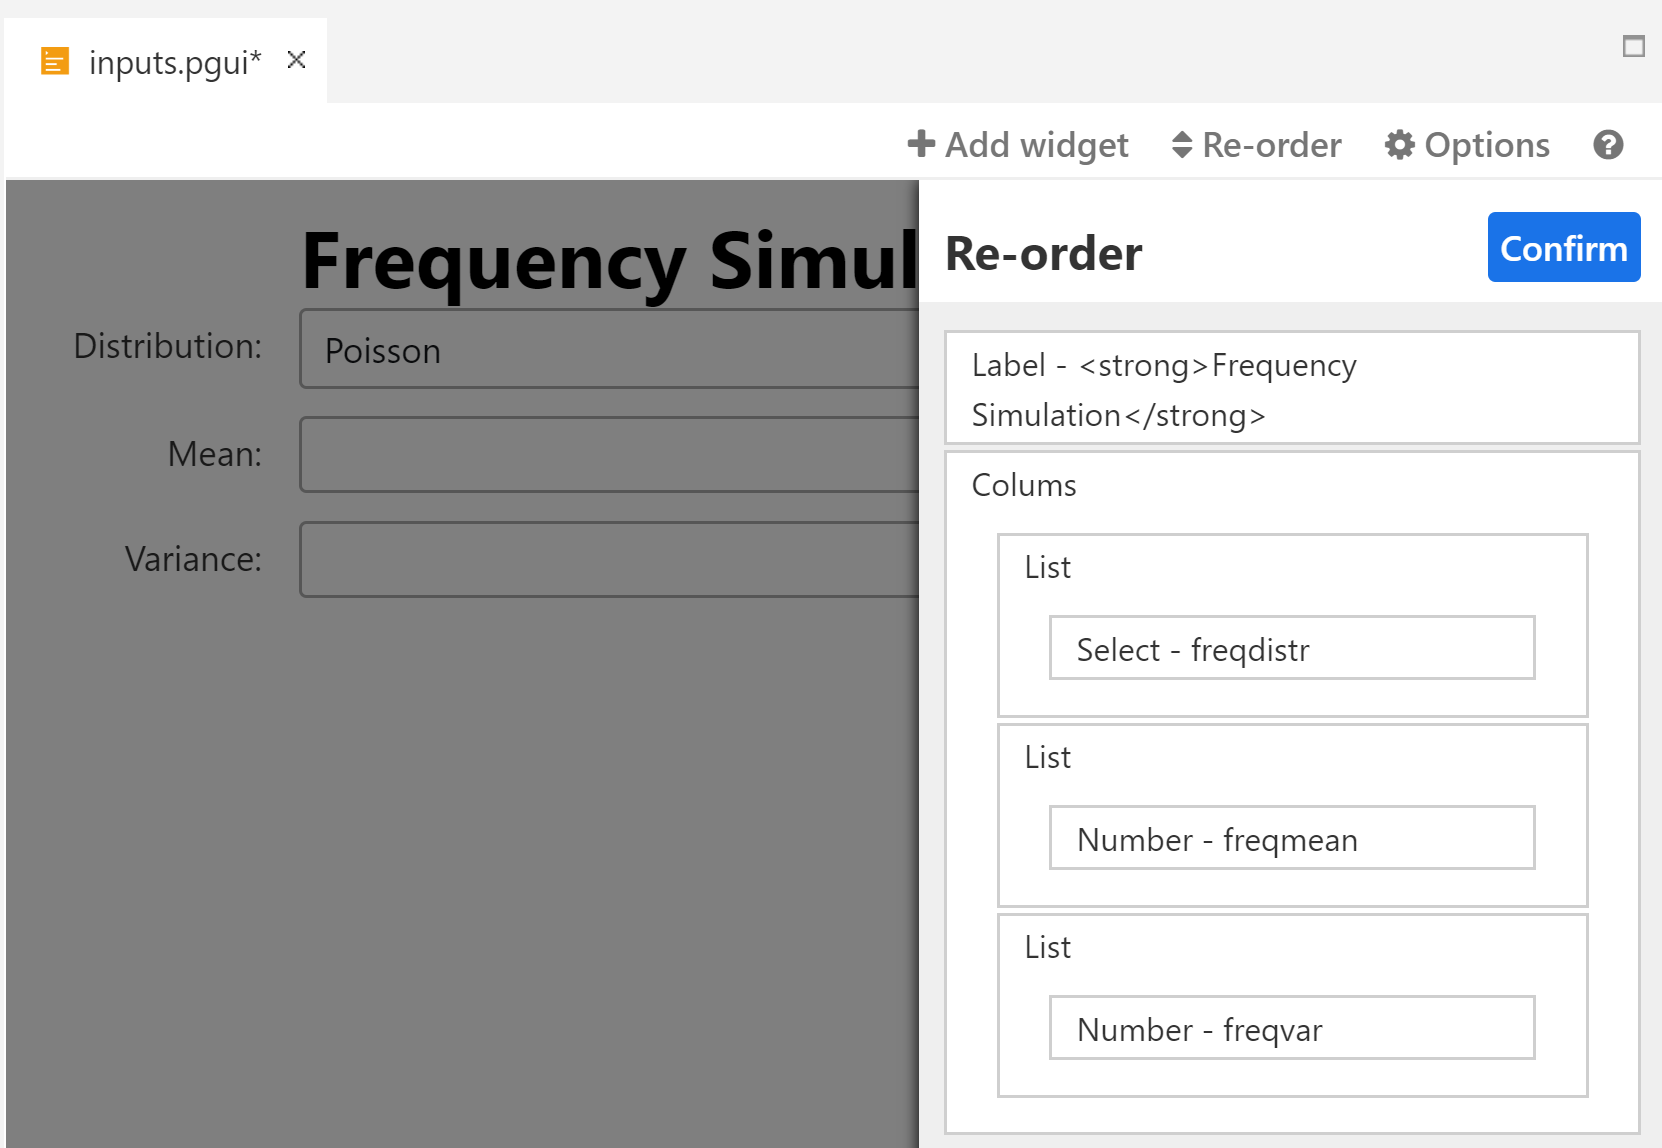
We will now create a better UI with a layout, by placing the three input widgets in a single line. Add a widget Column. The widget is not directly visible but you can see it by placing your mouse over it. Click on Re-order on the GUI Editor top bar and you can see all the widgets. The widgets Column has by default three columns represented by a list. Using the mouse, with a drag and drop, place the Select widget in the first List, the widget Number freqmean in the second one, and the widget Number freqvar in the third one.
However the display of each widget does not look right because of the space required for the widget's labels. In this case, change the Label position of the three widgets from Left to Top. Then press F5 to execute the program and it displays properly.

Adding dynamism
Recall that the Poisson distribution is fully characterized by its mean. We would like to hide the Variance field when the Poisson distribution is selected. This will be done using the field R when changed: of the widget freqdistr. We will first create the function that will show or hide the Variance field.
Add an R file to your project and name it pre-inputs.R. Add it to the sequencer before inputs.pgui.
Add the following code that we will explain:
RChange_Distr <- function()
{
    if(freqdistr == "pois")
        gui.hide("this", "freqvar")
    if(freqdistr == "nbinom")
        gui.show("this", "freqvar")
}
- When the Value of the widget freqdistr is changed, the code in R when changed: is executed, so the function
RChange_Distris executed. This is called Dynamism. - During the dynamism, you have access to the values of all widgets. In particular, we have access to the current value of freqdistr.
- We test the new value of freqdistr. If it is
"pois", we have to hide the variance field. This is done withgui.hide. If it isnbinom, we have to show the variance field. This is done withgui.show. - Both function require two arguments. The first one refers to the ID of the step in which the widget is modified. Here, since we modify a widget in the active step (the function is called when the corresponding PGM interface (.pgui) is active), we can use the handy shortcut
"this". The second one refers to the ID of the modified widget. Here, we hide or show"freqvar".
Now execute the program and change the value of freqdistr, the correct output is displayed. However, when you enter this GUI step, the distribution is Poisson and the variance is visible, because no change occurred before. We would like to hide the field when we first enter the GUI.
Modifying the GUI before entering
Add the following code to the file pre-inputs.R:
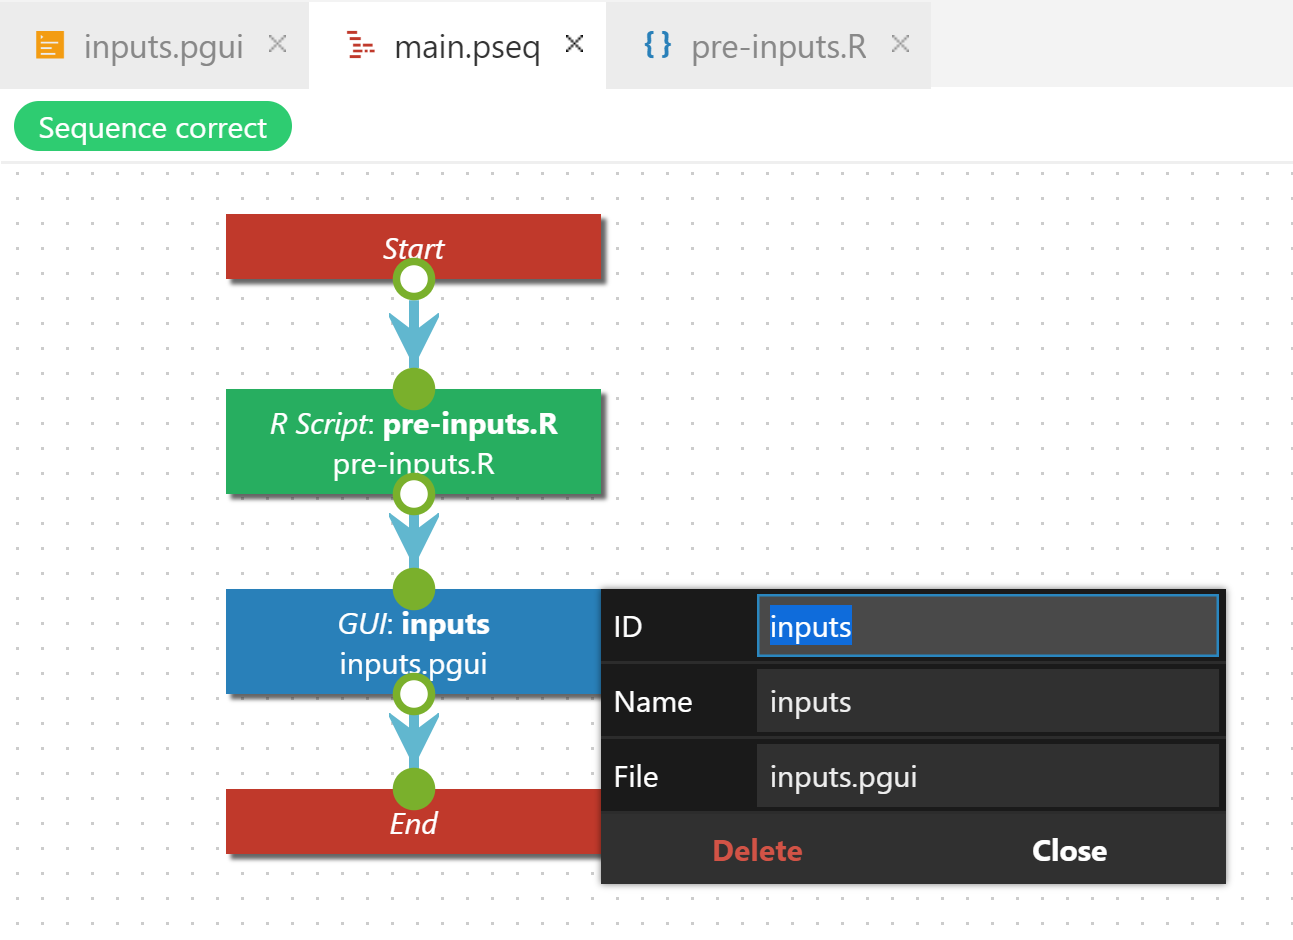
Note that we can't use "this" because we are in a Script step which is not the same as the GUI step inputs we want to change. We have to specify it, this is done using rpgm.step("main", "inputs"). The first argument refers to the sequence file, which is "main" here (a program can have multiple sequences). The second argument, "inputs", is the ID of the step. You can find it in the sequencer.
It now works as expected, when we enter the Inputs stage, the field variance is hidden.

Adding Columns and Tabs widgets
Now we will ask for a number of simulations, add a button to do the simulation and we will show an histogram.
First we add a Number widget with ID n, select the Type of the Number widget Integer, since we look for a number of simulations. Also add a button with Value Execute (the displayed text), and Style Secondary.
Add a widget Column and place the last two widgets in the first column like this.
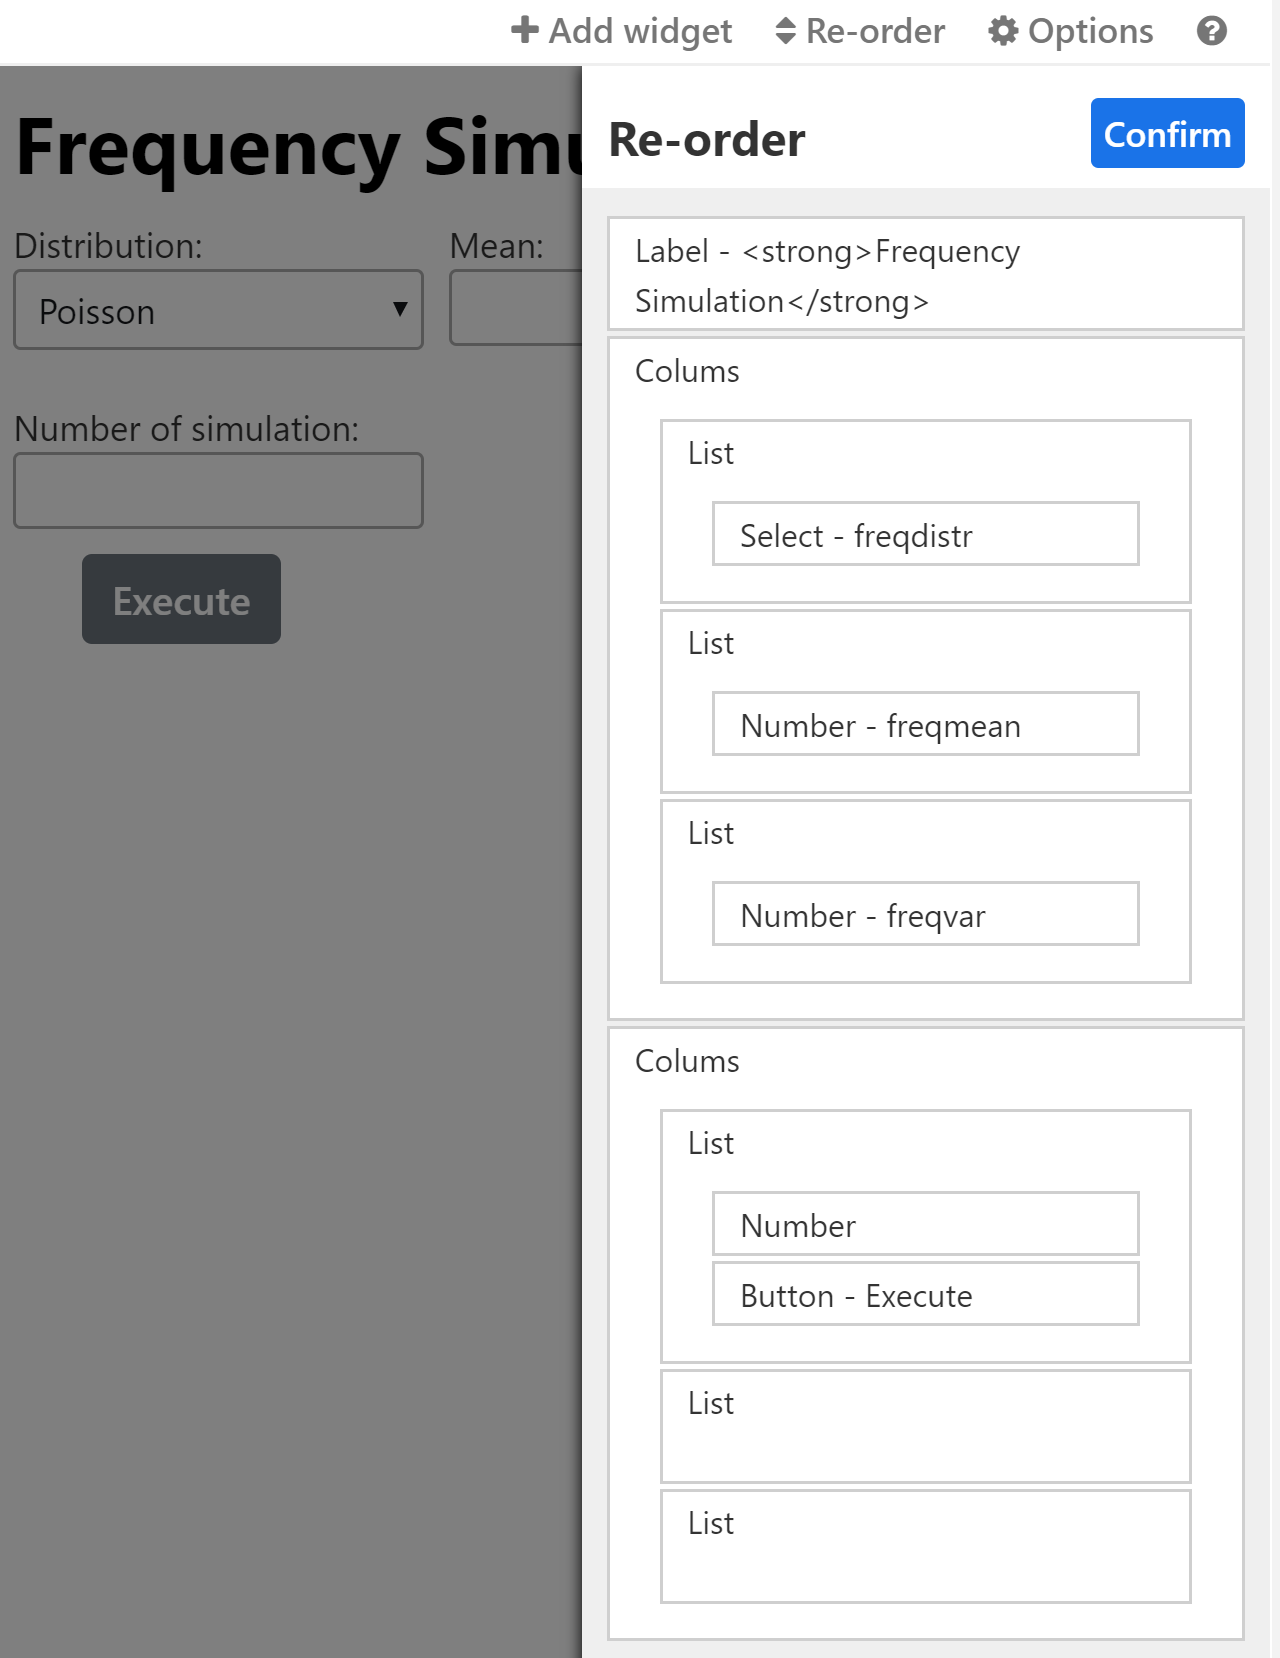
To give a better style to the button, you can remove the Label (Label position: No label) and select Full width for the Size of the button.
In the field R when pressed of the button, we will place the R code that will be executed when pressed. This will display the histogram of the simulation. We have two ways to display a graphic, from R or with plotly. We will do both and place each on a specific Tab.
- Add a widget Tab
- Add a widget Image (for the graphic from R), with ID Rgraph
- Add a widget Graph (for the graphic from plotly), with ID plotlygraph
- Place the widget Tab in the second column
- Place the widget Image and the widget Graph in the widget Tab
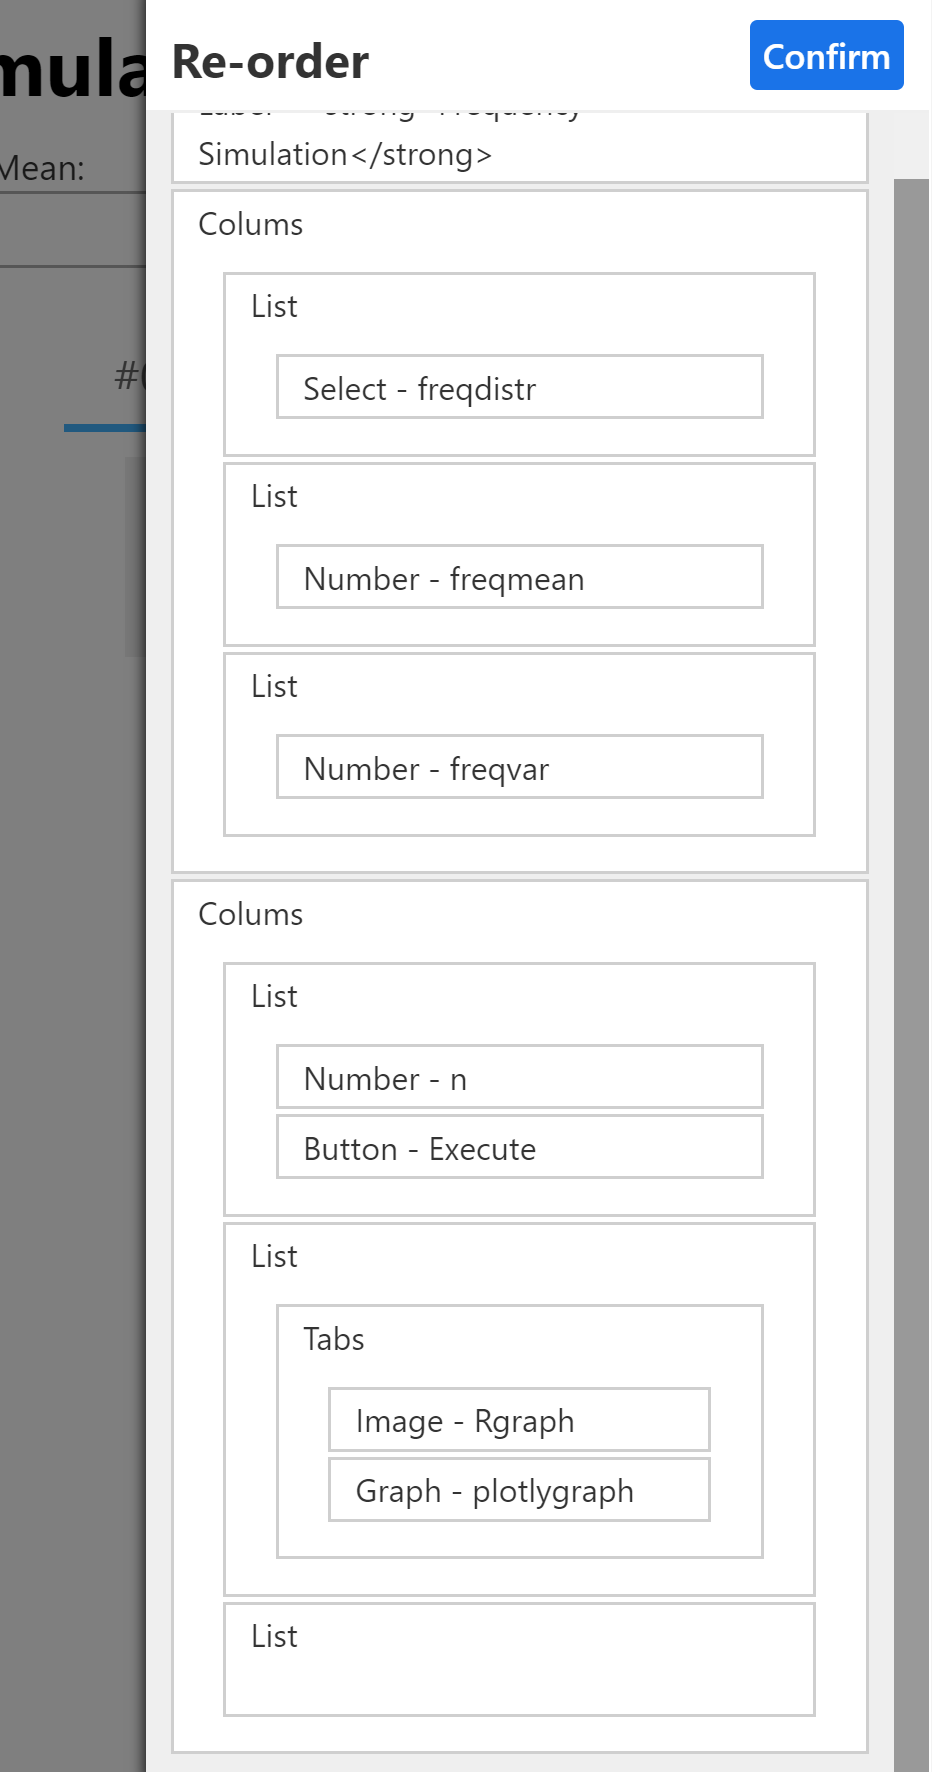
Now we manage the display of the Tabs:
- Click on the Tab widget (on the left of the first tab, for example), and add two lines with Add line
- Under Tabs Names:, add: R graph and Plotly graph
- On the widget Image and Graph, remove the Label (Label position: No label)
We do not need to have three columns. Select the widget column and click on Delete on the third column. The total length of the columns should always be 12, so modify the length of the second column to 8.
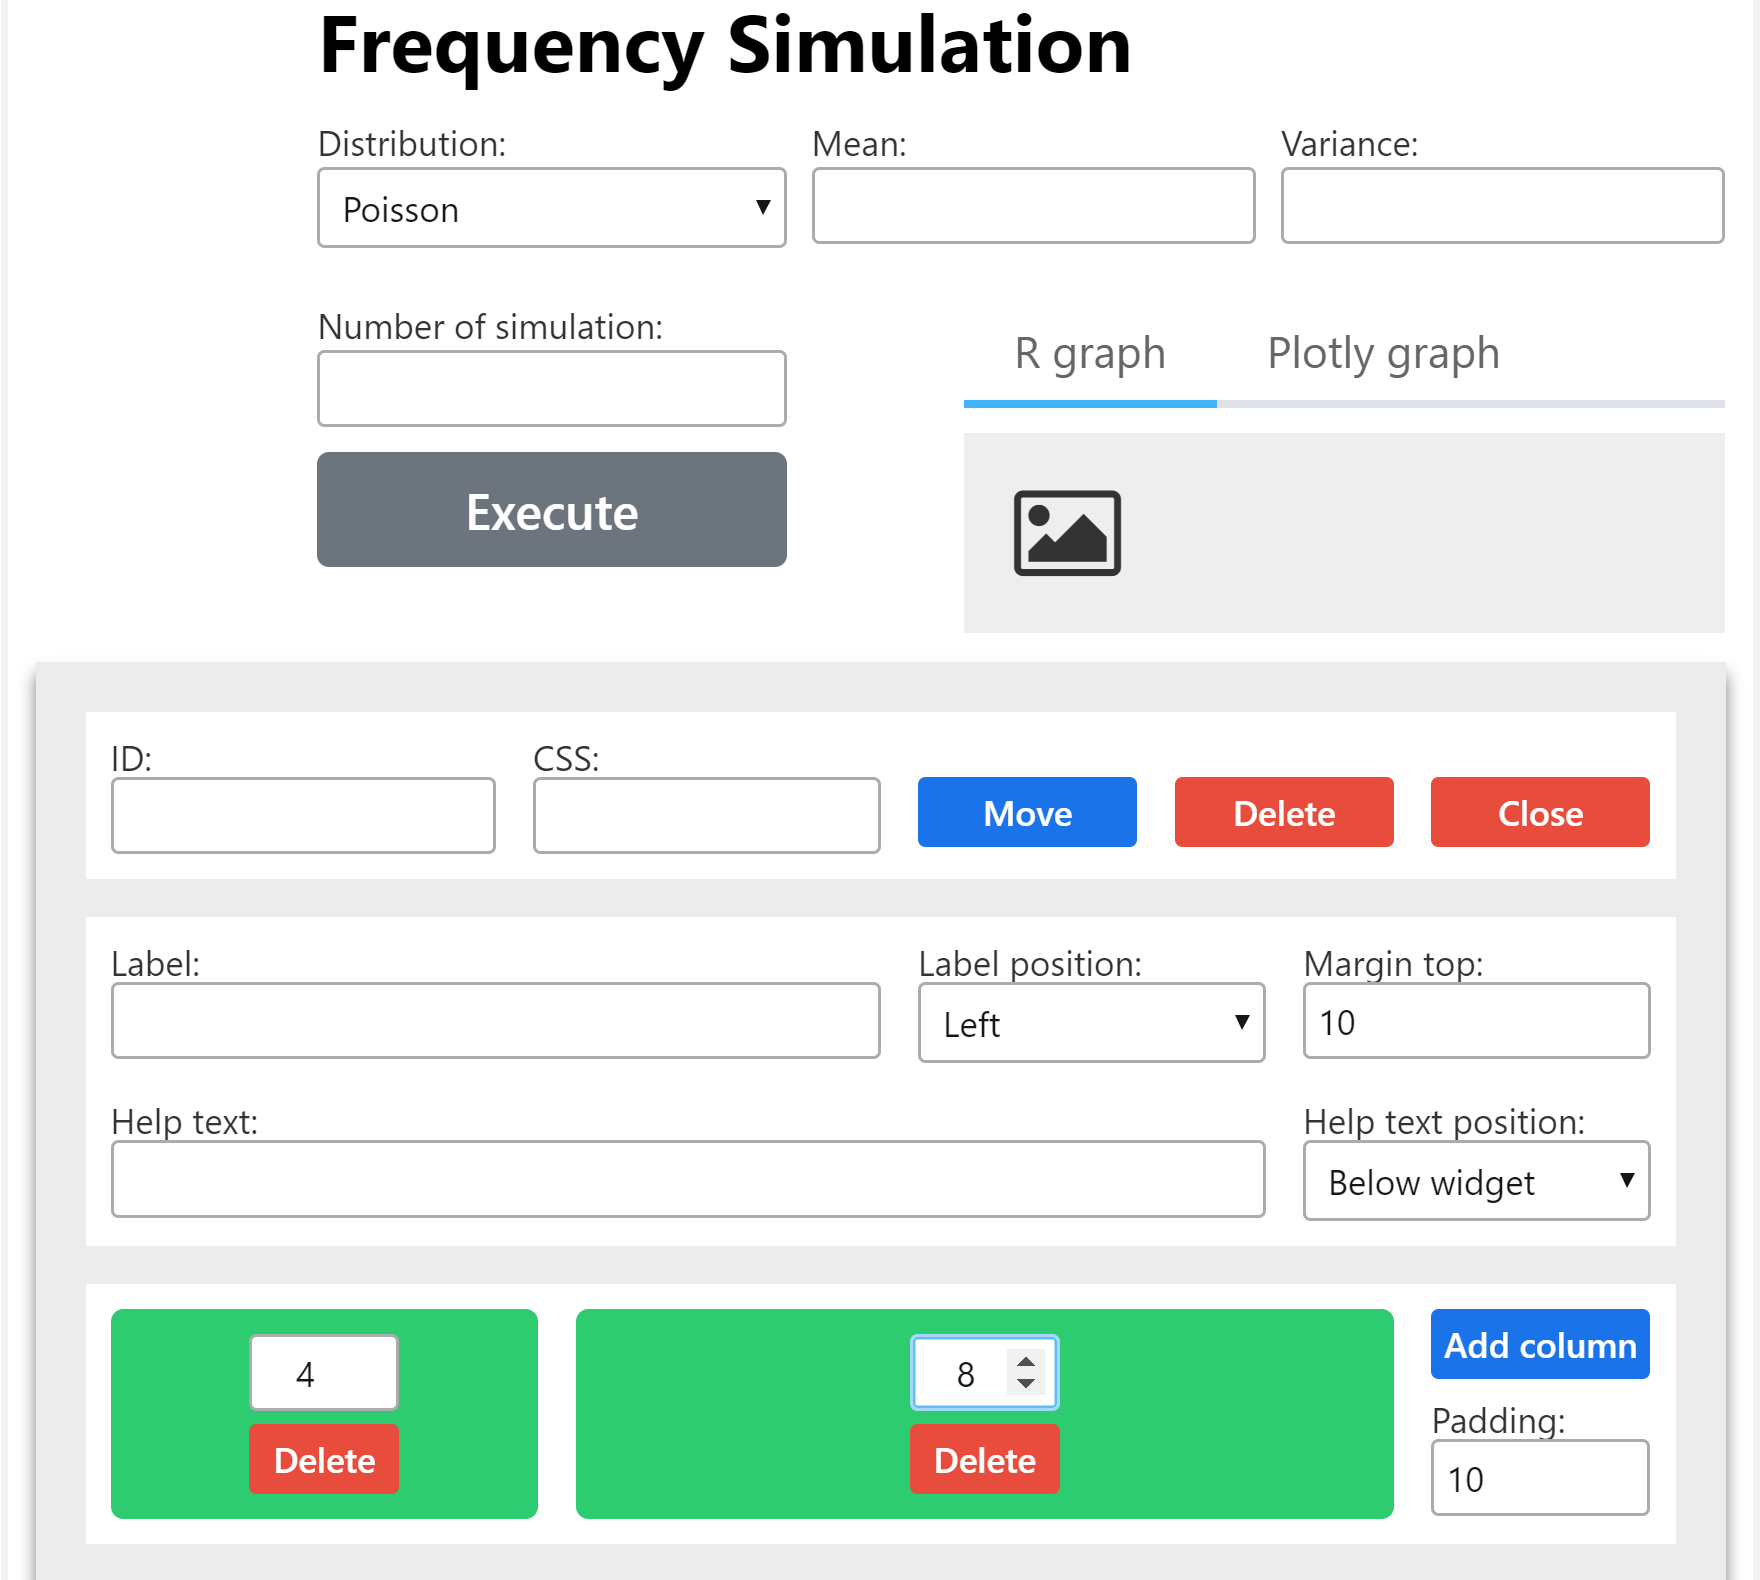
Creating the graphic
Graphics must now be created. Add the following code to the file pre-inputs.R:
Simulation <- function()
{
    if(freqdistr == "pois")
    {
        N <- rpois(n, freqmean)
    }
    if(freqdistr == "nbinom")
    {
        N <- rnbinom(n, freqmean^2/(freqvar - freqmean), , freqmean)
    }

    # R graphic
    png(rpgm.outputFile("graph.png"), width = 720, height=720)
        hist(N, col = "lightblue")
    dev.off()
    gui.setValue("this", "Rgraph", rpgm.outputFile("graph.png"))

    # Plotly Graphic, transposing into R from: https://plot.ly/javascript/histograms/
    data <- list(x = N, type = "histogram")
    plotlygraph <- list(data)
    gui.setValue("this", "plotlygraph", plotlygraph)
}
- For the R graph version, we create an image as usual. We then update the graphique using the function
gui.setValue. It needs the step, likegui.showandgui.hide, and the ID of the widget in which we assign a new value, here it's the ID or our widget Image:"Rgraph". The third argument is the new value, here the path of the image. - For the plotly version, it works like the native plotly (in javascript) in R. Here is an example for a histogram. We just create the same lists in R. And the corresponding list is assigned to the widget
"plotlygraph".
Tip
You can find here a dedicated tutorial to Plotly with RPGM.
Add Simulation() to the field R when pressed of the button.
Execute the program, now when you click on the button, both graphics are updated!
There is only one drawback: before the click on the button, the render is not correct, as the image and the graphic do not exist yet.
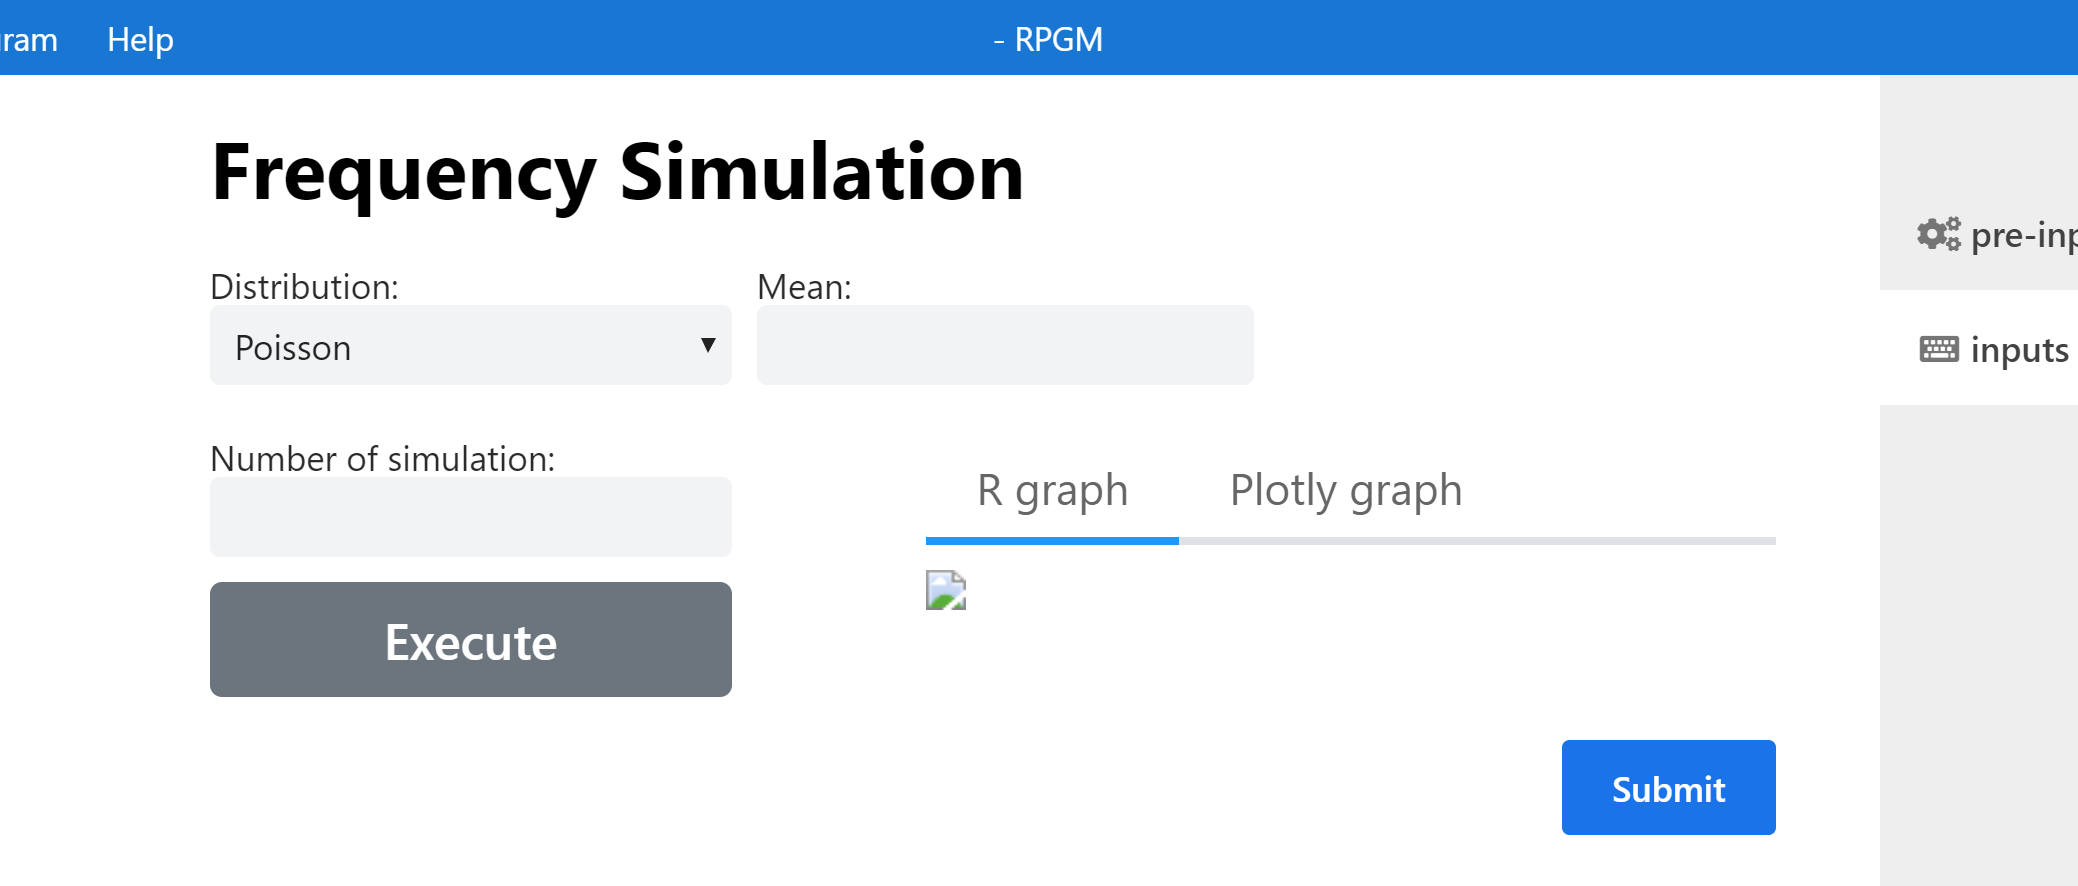
Fixing the undefined image
To make it clean is simple, we just need to hide the widget before the first push on the button.
Add the following code to pre-inputs.R:
gui.hide(rpgm.step("main", "inputs"), "Rgraph")
gui.hide(rpgm.step("main", "inputs"), "plotlygraph")
Both graphics are hidden. To show them, add inside the function Simulation, at the end, the following code:
Now the GUI is clean even when we enter the GUI, and we can play with the widgets.
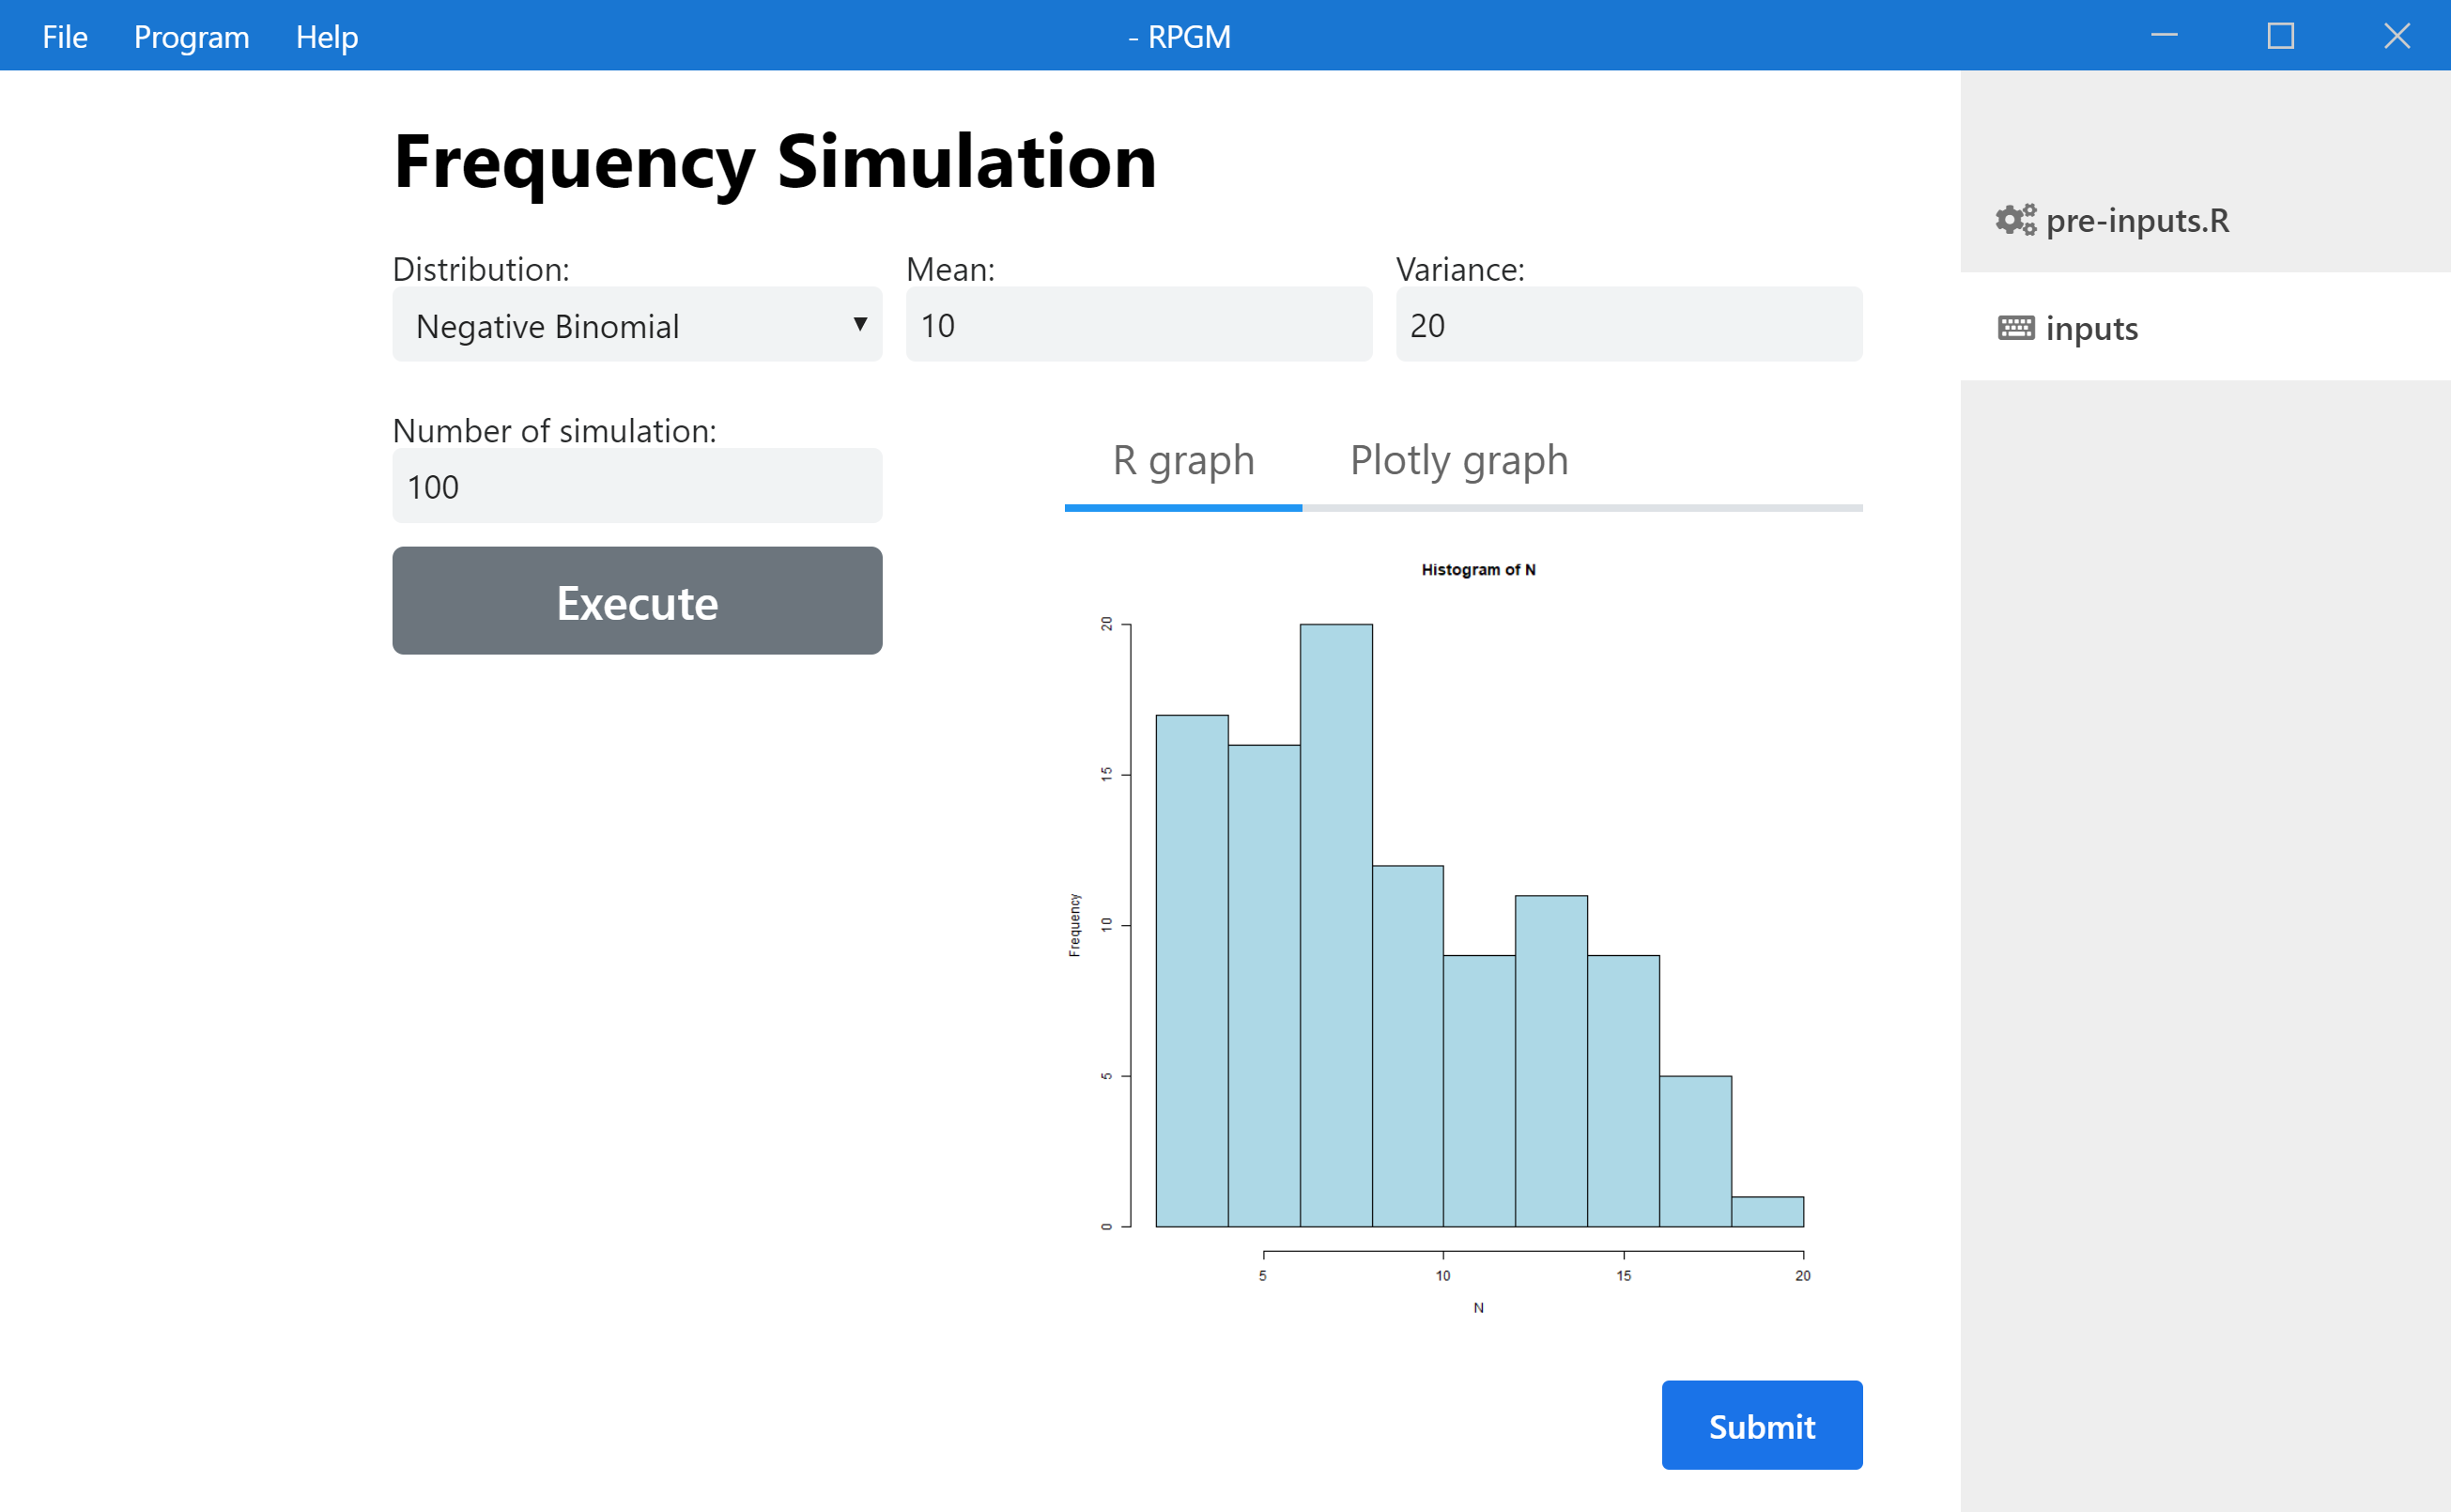
Hiding Submit button
Finally, since we have a dashboard, we do not need the button Submit. In the top bar of the GUI Editor, there is an Options button. Uncheck the checkbox for hiding the Submit button. We also can remove the side bar with the historic of steps by going in project.ppro file, and select Hide in Show step list.
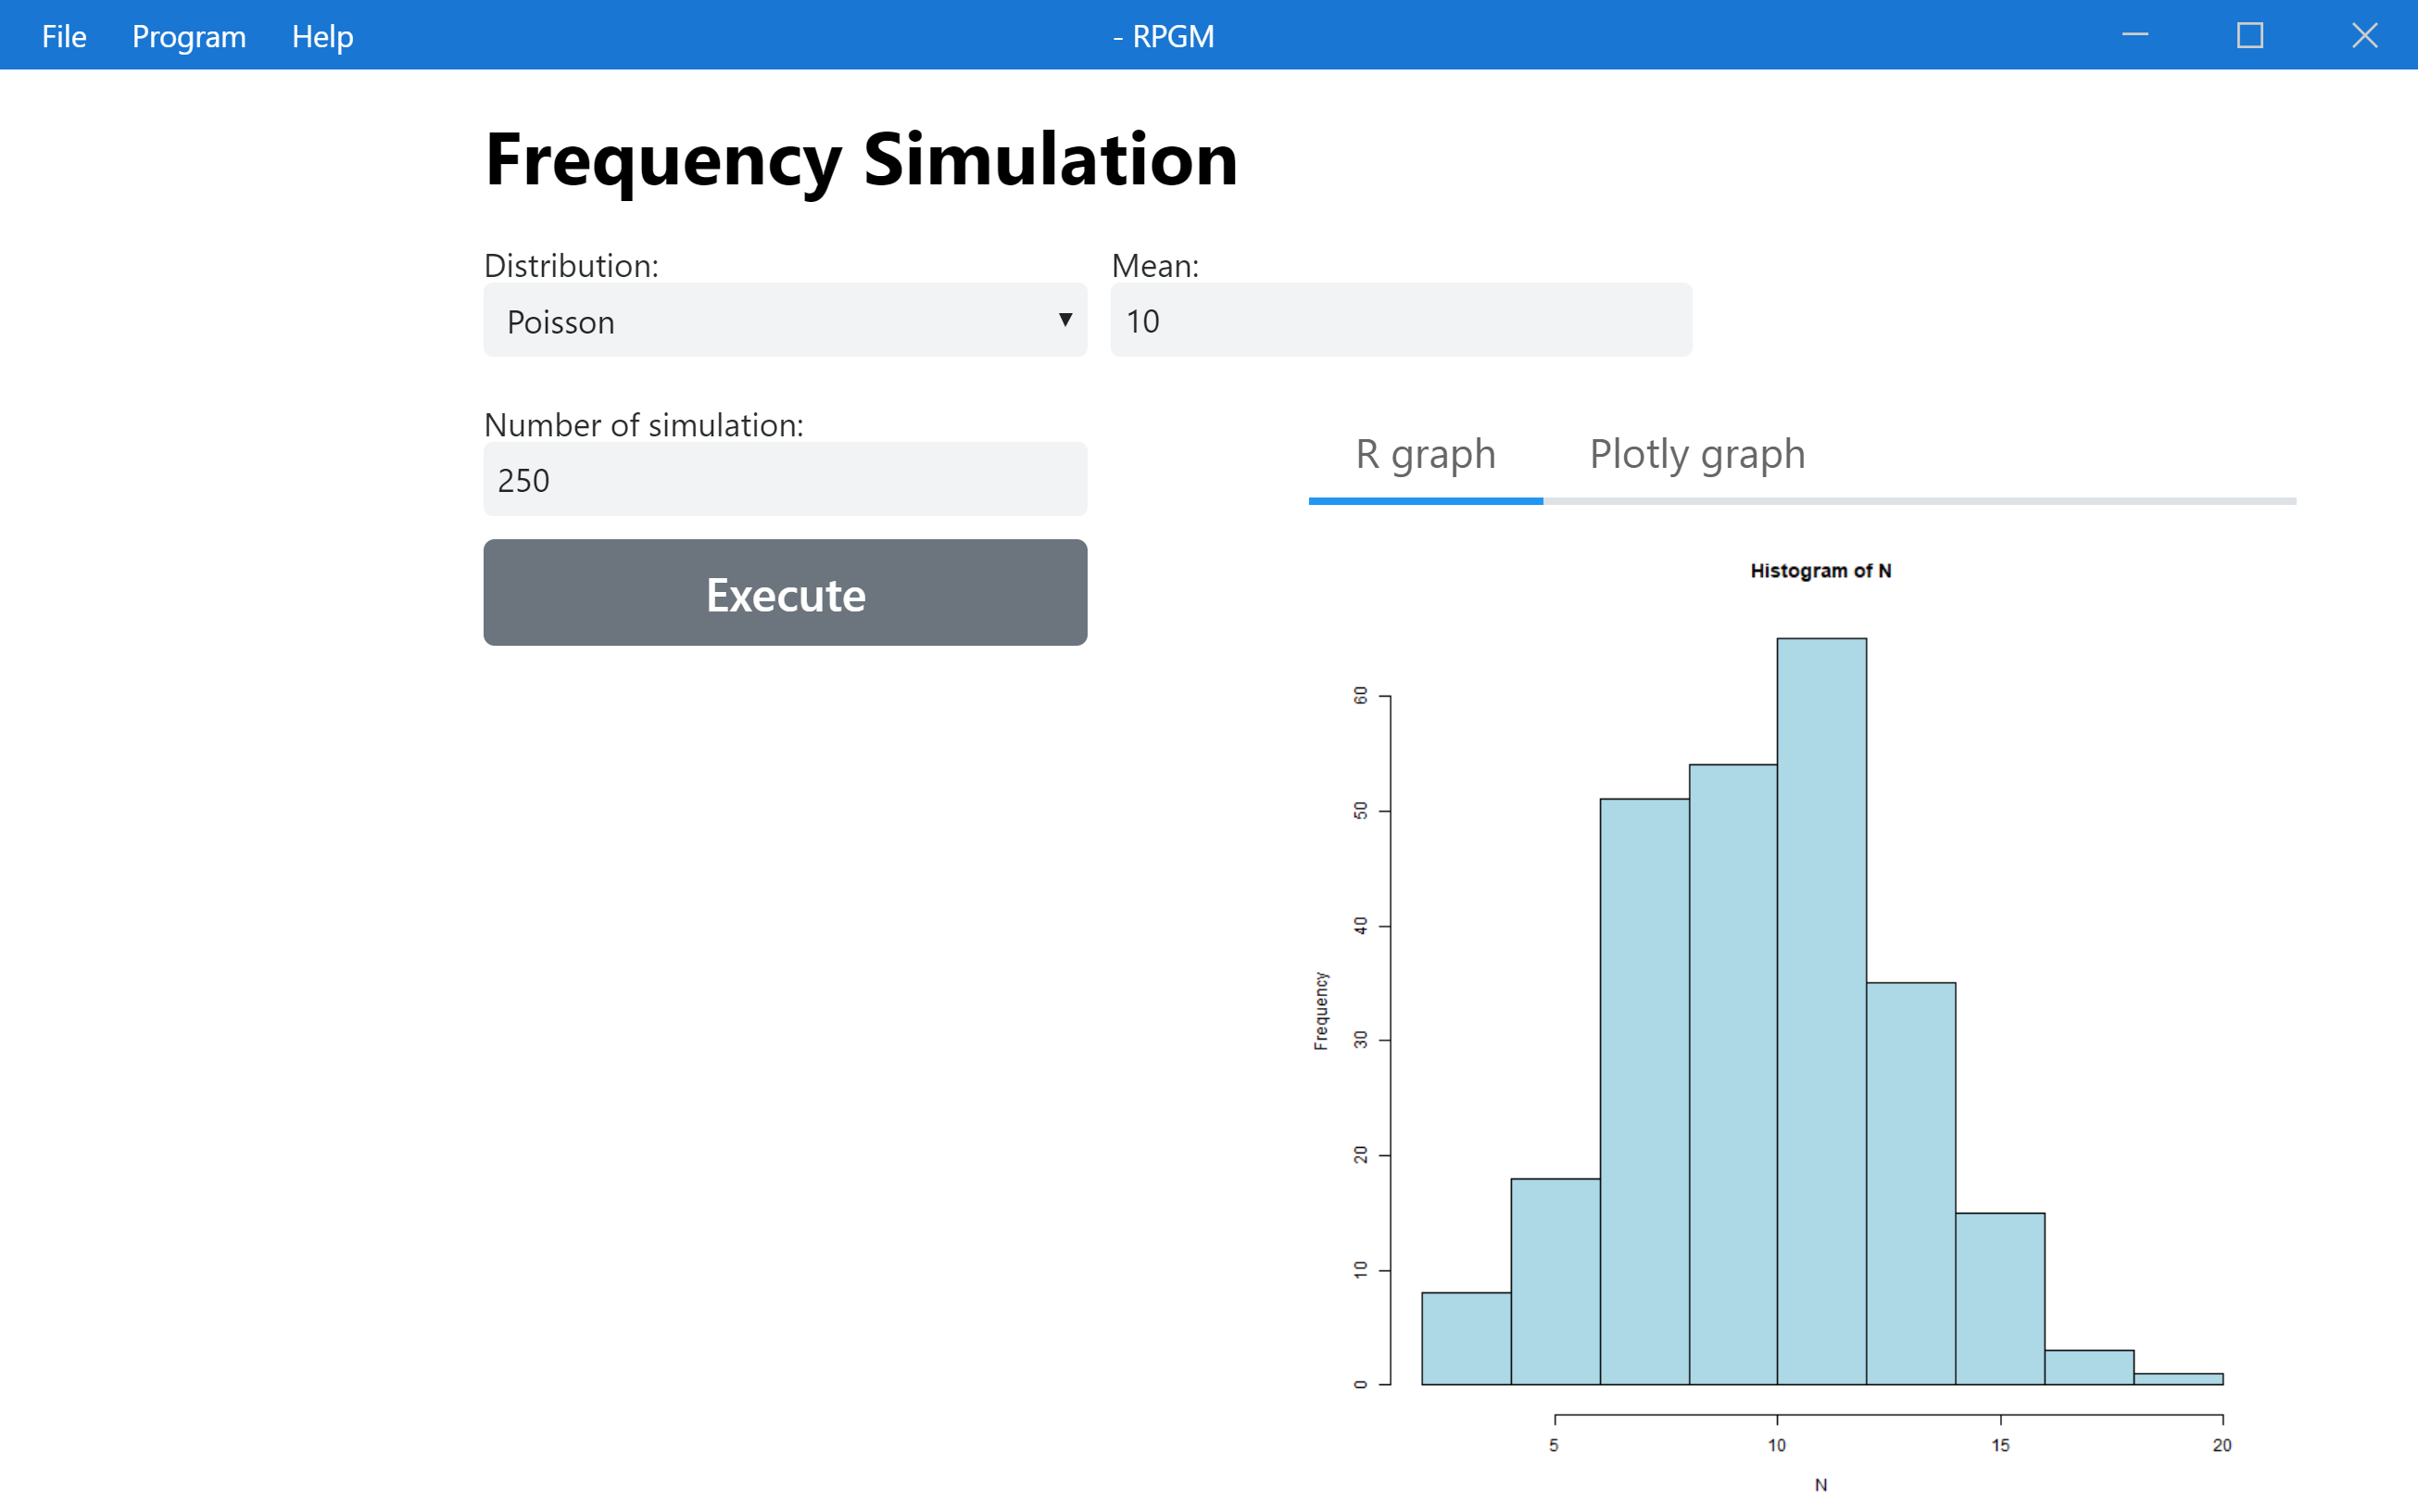
This ends our first management of the layout with dynamic interfaces! You can download the program as a pgm file for RPGM here (that you can create with the top menu PGM -> Export as PGM) and as a zip file containing all the project for RCode here.